Understanding research metrics
Introduction
Learn about the range metrics you can use to help monitor your journal’s performance and how you can support the responsible use of research metrics.What are research metrics?
Research metrics are quantitative tools used to help assess the quality and impact of research outputs. Metrics are available for use at the journal, article, and even researcher level. However, any one metric only tells a part of the story and each metric also has its limitations. Therefore, a single metric should never be considered in isolation.
For a long time, the only tool for assessing journal performance was the Impact Factor – more on that in a moment. Now there are a range of different research metrics available, from the Impact Factor to altmetrics, h-index, and more.
But what do they all mean? How is each metric calculated? Which research metrics are the most relevant to your journal? And how can you use these tools to monitor your journal’s performance?
Keep reading for a more in-depth look at the range of different metrics available.
Supporting the responsible use of research metrics
In March 2021 Taylor & Francis signed the San Francisco Declaration on Research Assessment (DORA), which aims to improve the ways in which researchers and the outputs of scholarly research are evaluated.
We firmly believe that researchers should be assessed on the quality and broad impact of their work. While research metrics can help support this process, they should not be used as a quick substitute for proper review. The quality of an individual research article should always be assessed on its own merits rather than on the metrics of the journal in which it was published. Find out more.
Using metrics to promote your journal
Journal metrics can be a useful tool for researchers when they’re choosing where to submit their research. You may therefore be asked by prospective authors about your journal’s metrics. You might also want to highlight certain metrics when you’re talking about the journal, to illustrate its reach or impact.
If you do, we advise that you always quote at least two different metrics, to give researchers a richer view of journal performance. Please also accompany this quantitative data with qualitative information that will help researchers assess the suitability of the journal for their research, such as its aims & scope.
Our researcher guide to understanding journal metrics explains in more detail how authors can use metrics as part of the process of choosing a journal.
How to use metrics to monitor your journal
Metrics can help you assess your journal’s standing in the community, raise its profile, and support growth in high-quality submissions. But only if you know how to interpret and apply them.
Journal metrics on Taylor & Francis Online
Most journals on Taylor & Francis Online display a range of metrics, to help give a rounded view of a journal’s performance, reach, and impact. These metrics include usage, citation metrics, speed (review and production turnaround times), and acceptance rate.
Read the guide to Taylor & Francis Online journal metrics for more details about how they’re calculated and the advice given to researchers about their use.
How to identify the right metrics for your journal
To monitor your journal’s performance, first you need to identify which research metrics are the most appropriate. To do this, think about your journal and its objectives.
It may help to structure this thinking around some key questions:
Who is your target audience?
For journals with a practitioner focus, academic citations may be less valuable than mentions in policy documents (as reported by Altmetric). If your journal is for a purely academic audience, traditional citation metrics like Impact Factor are more relevant. If your journal has a regional focus, then geographical usage might be important to you.
What are you trying to achieve?
If your objective is to publish more high-quality, high-impact authors, consider analyzing the h-indices of authors in recent volumes to assess whether you’re achieving this. If your aim is to raise your journal’s profile within the wider community, it makes sense to consider altmetrics in your analysis. Perhaps your goal is to generate more citations from high-profile journals within your field – so looking at Eigenfactor rather than Impact Factor would be helpful.
What subject area are you working in?
The relevancy of different research metrics varies hugely between disciplines. Is Impact Factor appropriate, or would the 5-year Impact Factor be more representative of citation patterns in your field? Which metrics are your competitors using? It might be more useful to think about your journal’s ranking within its subject area, rather than considering specific metrics in isolation.
What business model does your journal use?
For journals following a traditional subscription model, usage can be particularly crucial. It’s a key consideration for librarians when it comes to renewals.
How to interpret research metrics
It’s tempting to reach for simple numbers and extrapolate meaning, but be careful about reading too closely into metrics. The best strategy is to see metrics as generating questions, rather than answers.
Metrics simply tells us “what”. What are the number of views of the work? What are the number of downloads from the journal? What are the number of citations?
To interpret your metrics effectively, think less about “what” and use your metrics as a starting point to delve deeper into “who”, “how”, and “why”:
- Who is reading the journal? Where are they based, what is their role, how are they accessing it?
- Who are the key authors in your subject area? Where are they publishing now?
- How are users responding to your content? Are they citing it in journals, mentioning it in policy documents, talking about it on Twitter?
- How is your subject area developing? What are the hot topics, emerging fields, and key conversations?
- Why was a specific article successful? What made the media pick up on it, what prompted citations from other journals, who was talking about it?
It’s easy to damage the overall picture of your research metrics by focusing too much on one specific metric. For example, if you wanted to boost your Impact Factor by publishing more highly-cited articles, you might be disregarding low-cited articles used extensively by your readers. Therefore, if you chose to publish only highly-cited content for a higher Impact Factor, you could lose the value of your journal for a particular segment of your readership.
Generally, the content most used by practitioners, educators, or students (who don’t traditionally publish) is not going to improve your Impact Factor, but will probably add value in other ways to your community.
Fundamentally, it’s important to consider a range of research metrics when monitoring your journal’s performance. It can be tempting to concentrate on one metric, like the Impact Factor, but citations are not the be-all and end-all.
Think about each research metric as a single tile in a mosaic: you need to piece them all together to see the bigger picture of journal performance.
Journal metrics: citations
Impact Factor
What is the Impact Factor?
The Impact Factor is probably the most well-known metric for assessing journal performance. Designed to help librarians with collection management in the 1960s, it has since become a common proxy for journal quality.
The Impact Factor is a simple research metric: it’s the average number of citations received by articles in a journal within a two-year window.
The Web of Science Journal Citation Reports (JCR) publishes the official results annually, based on this calculation:
Number of citations received in one year to content published in Journal X during the two previous years, divided by the total number of articles and reviews published in Journal X within the previous two years.
For example, the 2022 Impact Factors (released in 2023) used the following calculation:
Number of citations received in 2022 to content published in Journal X during 2020 and 2021, divided by the total number of articles and reviews published in Journal X in 2020 and 2021.
How can I get an Impact Factor for my journal?
Only journals selected to feature in the Science Citation Index Expanded (SCIE) and Social Sciences Citation Index (SSCI) receive an official Impact Factor.
To be eligible for coverage in these Web of Science indices, journals must meet a wide range of criteria. You can find out more about the journal selection process on the Clarivate website.
For many journals, the first step to receiving an Impact Factor is to feature in the Emerging Sources Citation Index (ESCI). For more information on the ESCI, read our introduction here.
What are the disadvantages of the Impact Factor?
- The Impact Factor is an arithmetic mean and doesn’t adjust for the distribution of citations.
This means that one highly-cited article can have a major positive effect on the Impact Factor, skewing the result for the two years. Most journals have a highly-skewed citation distribution, with a handful of highly-cited articles and many low- or zero-cited articles.
- The JCR doesn’t distinguish between citations made to articles, reviews, or editorials.
So that the Impact Factor doesn’t penalize journals that publish rarely-cited content like book reviews, editorials, or news items, these content types are not counted in the denominator of the calculation (the total number of publications within the two-year period). However, citations to this kind of content are still counted.
This creates two main problems. Firstly, the classification of content is not subjective, so content such as extended abstracts or author commentaries fall into an unpredictable gray area. Secondly, if such articles are cited, they increase the Impact Factor without any offset in the denominator of the equation.
- The Impact Factor only considers the number of citations, not the nature or quality.
An article may be highly cited for many reasons, both positive and negative. A high Impact Factor only shows that the research in a given journal is being cited. It doesn’t indicate the context or the quality of the publication citing the research.
- You can’t compare Impact Factors like-for-like across different subject areas.
Different subject areas have different citation patterns, which reflects in their Impact Factors. Research in subject areas with typically higher Impact Factors (cell biology or general medicine, for example) is not better or worse than research in subject areas with typically lower Impact Factors (such as mathematics or history).
The difference in Impact Factor is simply a reflection of differing citation patterns, database coverage, and dominance of journals between the disciplines. Some subjects generally have longer reference lists and publish more articles, so there’s a larger pool of citations.
- Impact Factors can show significant variation year-on-year, especially in smaller journals.
Because Impact Factors are average values, they vary year-on-year due to random fluctuations. This change is related to the journal size (the number of articles published per year): the smaller the journal, the larger the expected fluctuation.
What is the 5-year Impact Factor?
The 5-year Impact Factor is a modified version of the Impact Factor, using five years’ data rather than two. A journal must be covered by the JCR for five years or from Volume 1 before receiving a 5-year Impact Factor.
The 5-year Impact Factor calculation is:
Number of citations in one year to content published in Journal X during the previous five years, divided by the total number of articles and reviews published in Journal X within the previous five years.
The 5-year Impact Factor is more useful for subject areas where it takes longer for work to be cited, or where research has more longevity. It offers more stability for smaller titles as there are a larger number of articles and citations included in the calculation. However, it still suffers from many of the same issues as the traditional Impact Factor.
Eigenfactor
In 2007, the Web of Science JCR grew to include Eigenfactors and Article Influence Scores (see below). Unlike the Impact Factor, these metrics don’t follow a simple calculation. Instead, they borrow their methodology from network theory.
What is an Eigenfactor?
The Eigenfactor measures the influence of a journal based on whether it’s cited within other reputable journals over five years. A citation from a highly-cited journal is worth more than from a journal with few citations.
To adjust for subject areas, the citations are also weighted by the length of the reference list that they’re from. The Eigenfactor is calculated using an algorithm to rank the influence of journals according to the citations they receive. A five-year window is used, and journal self-citations are not included.
This score doesn’t take journal size into account. That means larger journals tend to have larger Eigenfactors as they receive more citations overall. Eigenfactors also tend to be very small numbers as scores are scaled so that the sum of all journal Eigenfactors in the JCR adds up to 100.
Very roughly, the Eigenfactor calculation is:
Number of citations in one year to content published in Journal X in the previous five years (weighted), divided by the total number of articles published in Journal X within the previous five years.
Article Influence Score
What is an Article Influence Score?
The Article Influence Score is a measure of the average influence of a journal’s articles in the first five years after publication. A score greater than 1.00 shows above-average levels of influence.
The Article Influence Score calculation is:
(0.01 x Eigenfactor of Journal X) divided by (number of articles published in Journal X over five years, divided by the number of articles published in all journals over five years).
These are then normalized so that the average journal in the JCR has a score of 1.
Like 5-year Impact Factors, journals don’t receive an Article Influence Score unless they have been covered by the JCR for at least five years, or from Volume 1.
CiteScore
What is CiteScore?
CiteScore is the ratio of citations to research published. It’s currently available for journals and book series which are indexed in Scopus.
The CiteScore calculation only considers content that is typically peer reviewed; such as articles, reviews, conference papers, book chapters, and data papers.
The CiteScore calculation is:
Number of all citations recorded in Scopus in one year to content published in Journal X in the last four years, divided by the total number of items published in Journal X in the previous four years.
What are the differences between CiteScore and Impact Factor?
- CiteScore is based on the Scopus database rather than Web of Science. This means the number of citations and journal coverage in certain subject areas is notably higher.
- CiteScore uses a four-year citation window, whereas Impact Factor uses a two-year citation window.
- CiteScore covers all subject areas, whereas the Impact Factor is only available for journals indexed in the SCIE and SSCI.
CiteScore suffers from some of the same problems as Impact factor; namely that it isn’t comparable across disciplines and it is a mean calculated from a skewed distribution.
SNIP - Source Normalized Impact per Paper
SNIP is a journal-level metric which attempts to correct subject-specific characteristics, simplifying cross-discipline comparisons between journals. It measures citations received against citations expected for the subject field, using Scopus data. SNIP is published twice a year and looks at a three-year period.
The SNIP calculation is:
Journal citation count per paper, divided by citation potential in the field.
SNIP normalizes its sources to allow for cross-disciplinary comparison. In practice, this means that a citation from a publication with a long reference list has a lower value.
SNIP only considers citations to specific content types (articles, reviews, and conference papers), and does not count citations from publications that Scopus classifies as “non-citing sources”. These include trade journals, and many Arts & Humanities titles.
SJR - Scimago Journal Rank
The SJR aims to capture the effect of subject field, quality, and reputation of a journal on citations. It calculates the prestige of a journal by considering the value of the sources that cite it, rather than counting all citations equally.
Each citation received by a journal is assigned a weight based on the SJR of the citing journal. So, a citation from a journal with a high SJR value is worth more than a citation from a journal with a low SJR value.
The SJR calculation is:
Average number of (weighted) citations in a given year to Journal X, divided by the number of articles published in Journal X in the previous three years.
As with SNIP and CiteScore, SJR is calculated using Scopus data.
Journal metrics: usage, speed, and acceptance rate
As we’ve explained above, citations aren’t the only way to monitor the performance of your journal. The following metrics, which are available for many journals on Taylor & Francis Online, will help give you and your readers a more rounded view.
Usage
What does it measure? A journal’s usage is the number of times articles are viewed/downloaded. Gives a quick impression of the journal’s size and reach.
How is it calculated? The figure shown on Taylor & Francis Online is the total number of times articles in the journal were viewed by users in the previous calendar year, rounded to the nearest thousand. This includes all of the different formats available on Taylor & Francis Online, including HTML, PDF, and EPUB. Usage data for each journal is updated annually in February.
How can I access my journal’s usage data?
You can easily access article-level usage data via the “Metrics” tab on Taylor & Francis Online. We also provide more detailed annual usage reports to our journal editors. Find out more about the COUNTER compliant data we report with our brief introduction to Project COUNTER.
There are other online platforms which provide journal access, including aggregator services such as JSTOR and EBSCO. Of course, some readers still prefer print over online, so it’s important you consider these sources when building a broader picture of usage.
We’ve set out the limitations of this metric in our guide for researchers.
Speed metrics
The following speed metrics, which are available for many journals on Taylor & Francis Online, indicate how long different stages of the publishing process might take. The speed metrics published on Taylor & Francis Online are for the previous full calendar year and are updated in February.
All of these metrics have limitations, which authors should consider when using them to choose a journal. These limitations are set out in our researcher guide to understanding journal metrics.
Speed from submission to first decision
What does it measure? This metric indicates how long after submission it may take before you receive a decision about your article.
How is it calculated? This is the median number of days from submission to first decision for all manuscripts which received a first decision in the previous calendar year.
Speed from submission to first post-review decision
What does it measure? This metric only considers those articles that are sent out for peer review by experts in the field. It indicates how long it may take before you receive a decision on your peer reviewed article.
How is it calculated? This is the median number of days from submission to decision for all peer reviewed articles which received a first decision in the previous calendar year.
Speed from acceptance to online publication
What does it measure? This metric tells you about the journal’s production speed, indicating how long you are likely to wait to see your article published online once the journal’s editor has accepted it.
How is it calculated? On Taylor & Francis Online this figure is the median number of days from acceptance to online publication of the Version of Record, for articles published in the previous calendar year.
Acceptance rate
A journal’s acceptance rate is an indication of the number of submissions it receives for every article that’s eventually published.
How is it calculated? This figure represents the articles accepted by the journal for publication in the previous calendar year as a percentage of all papers receiving a final decision in that calendar year. It includes all article types submitted to the journal, including those that are rejected without being peer reviewed (desk rejects).
The acceptance rates published on Taylor & Francis Online are for the previous full calendar year and are updated in February.
We’ve set out the limitations of this metric in our guide for researchers.
Article metrics
Altmetric Attention Score
The Altmetric Attention Score tracks a wide range of online sources to capture the conversations happening around academic research.
How is the Altmetric Attention Score calculated?
Altmetric monitors each online mention of a piece of research and weights the mentions based on volume, sources, and authors. A mention in an international newspaper contributes to a higher score than a tweet about the research, for example.
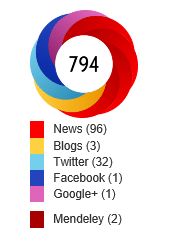
The Altmetric Attention Score is presented within a colorful donut. Each color indicates a different source of online attention (ranging from traditional media outlets to social media, blogs, online reference managers, academic forums, patents, policy documents, the Open Syllabus Project, and more). A strong Altmetric Score will feature both a high number in the center, and a wide range of colors in the donut.
Discover the different ways you can make Altmetric data work for you by reading this introduction from Altmetric’s Head of Marketing, Cat Chimes.
What are the advantages of the Altmetric Attention Score?
- Receive instant, trackable feedback
Altmetric starts tracking online mentions of academic research from the moment it’s published. That means there’s no need to wait for citations to come in to get feedback on a piece of research.
- Get a holistic view of attention, impact and influence
The data Altmetric gathers provides a more all-encompassing, nuanced view of the attention, impact, and influence of a piece of research than traditional citation-based metrics. Digging deeper into the Altmetric Attention Score can reveal not only the nature and volume of online mentions, but also who’s talking about the research, where in the world these conversations are happening, and which online platforms they’re using.
What are the disadvantages of the Altmetric Attention Score?
- Biases in the data which Altmetric collects
There’s a tendency to focus on English-speaking sources (there’s some great thinking around this by Juan Pablo Alperin). There’s also a bias towards Science, Technology and Medicine (STM) topics, although that’s partly a reflection of the activity happening online around research.
- Limited to tracking online attention
The Altmetric Attention Score was built to track digital conversations. This means that attention from sources with little direct online presence (like a concert, or a sculpture) are not included. Even for online conversations, Altmetric can only track mentions when the source either references the article’s Digital Object Identifier (DOI) or uses two pieces of information (i.e. article title and author name).
Author metrics
h-index
What is the h-index?
The h-index is an author-level research metric, first introduced by Hirsch in 2005. The h-index attempts to measure the productivity of a researcher and the citation impact of their publications.
The basic h-index calculation is:
Number of articles published which have received the same number of citations.
For example, if you’ve published at least 10 papers that have each been cited 10 times or more, you will have a h-index of 10.
What are the advantages of the h-index?
- Results aren’t skewed
The main advantage of the h-index is that it isn’t skewed upwards by a small number of highly-cited papers. It also isn’t skewed downwards by a long tail of poorly-cited work.
The h-index rewards researchers whose work is consistently well cited. That said, a handful of well-placed citations can have a major effect.
What are the disadvantages of the h-index?
- Results can be inconsistent
Although the basic calculation of the h-index is clearly defined, it can still be calculated using different databases or time-frames, giving different results. Normally, the larger the database, the higher the h-index calculated from it. Therefore, a h-index taken from Google Scholar will nearly always be higher than one from Web of Science, Scopus, or PubMed. (It’s worth noting here that as Google Scholar is an uncurated dataset, it may contain duplicate records of the same article.)
- Results can be skewed by self-citations
Although some self-citation is legitimate, authors can cite their own work to improve their h-index.
- Results aren’t comparable across disciplines
The h-index varies widely by subject, so a mediocre h-index in the life sciences will still be higher than a very good h-index in the social sciences. We can’t benchmark h-indices because they are rarely calculated consistently for large populations of researchers using the same method.
- Results can’t be compared between researchers
The h-index of a researcher with a long publication history including review articles cannot be fairly compared with a post-doctoral researcher in the same field, nor with a senior researcher from another field. Researchers who have published several review articles will normally have much higher citation counts than other researchers.
Save page as PDF
version of this page.
For the best results we recommend using
Google Chrome.